
by DOUG HENWOOD
 IMAGE/Duck Duck Go
Stock markets have stabilized, at least for now, after a few days of what the press likes to call “turmoil.” What does it all mean?
There’s no doubt that stocks have been due for a comeuppance for some time: they’re very expensive. Since stocks represent claims on corporate profits, present and future, the conventional way to value them is by measuring their price against those underlying profits (or “earnings” in Wall Street lingo, since to the owning class, profits from capital are just like wages for labor: as they like to say, they put their money to work). Ideally they’d be measured against future profits, but no one knows what they are, so the next-best thing to do is measure them against past profits.
The standard measure for that is the price/earnings (PE) ratio—the price of a stock (or a stock market index) divided by corporate profits per share (or total profits of the stocks in the index). Since the late 19th century, the PE ratio for the broad stock market has averaged 16; since 1950, it’s averaged 18. It’s now 27. But PE’s can be volatile. To adjust for that, Yale economist Robert Shiller invented a longer-term measure, which adjusts profits for inflation and measures current prices against their ten-year trailing average. The century-plus average is 17; since 1950, it’s 19. It’s now 33. As the graph below shows, Shiller’s PE is higher today than it was at any point in a history that begins in 1881 except for the climax of the late-1990s bubble. It was lower in 1929 than it is today.

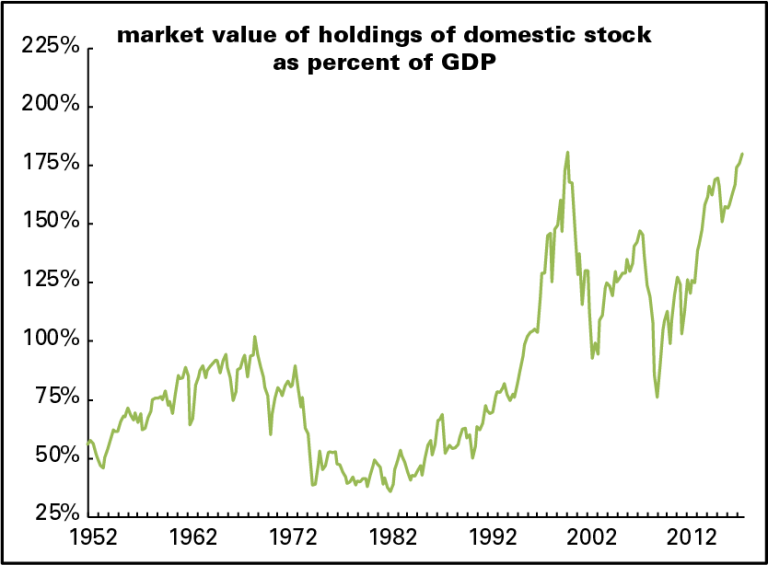
Another valuation technique is comparing the value of all stocks outstanding to GDP. That is now only a hair below its 2000 peak (see graph below).
And what about profits? Profits recovered far more quickly and dramatically than wages after the end of the Great Recession. In the first three years after that miserable event came to a formal close (2009–2012), corporate profits after taxes rose 55%. Meanwhile what corporations paid their employees rose just 12%. Stocks became quite rationally exuberant, celebrating the rise in profits and its likely continuation. Over those three years, stocks (measured by the S&P 500) rose 85%, taking them close to where they were before the financial crisis hit. The momentum in profit growth slowed (and that in wages and salaries picked up), but that didn’t stop stocks from rising further, surpassing the 2007 high in 2013, and then adding another 56% through the election of Trump. All that despite the fact that, as the graph below shows, corporate profitability peaked between 2012 and 2014 and has been edging down since.
Left Business Observer for more